The genetic analysis of
high-throughput phenotypes
Karl Broman
Biostatistics & Medical Informatics, University of Wisconsin – Madison
kbroman.org

github.com/kbroman

@kwbroman
slides: bit.ly/Texas2015

Biostatistics & Medical Informatics, University of Wisconsin – Madison
kbroman.org
github.com/kbroman
@kwbroman
slides: bit.ly/Texas2015

2


3

4
5

5

6
7
8

kbroman.wordpress.com/2012/04/25/microarrays-suck
9

kbroman.wordpress.com/2012/04/25/microarrays-suck
10
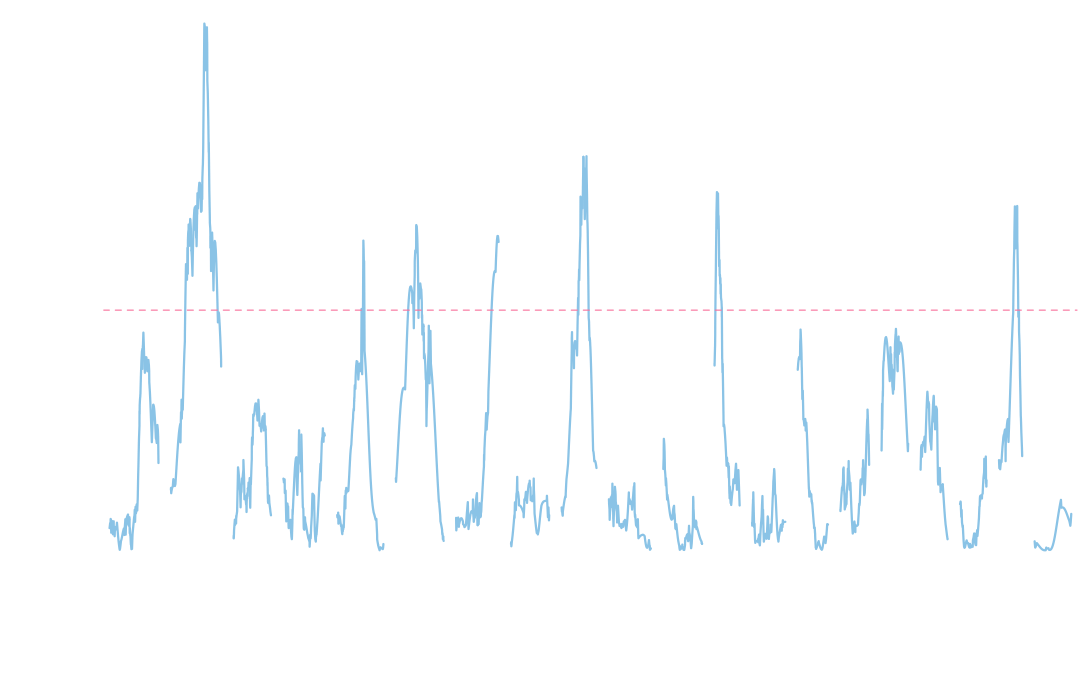
FAD_NAD SI 8.3_3.3G”?11
12
13
14

Kim et al (2007) PNAS 104:20274–20279
15

16

17

18

19

Shaffer et al. (2013) J Dent Res 92:32-37
20
21
22
23
24
25
26
27
You just need to learn html, css, svg, and javascript.
And don’t forget .enter()
28
 |
 |
 |
 |
 |
 |
29
30
| Alan Attie Mark Keller |
Biochemistry, UW–Madison | |
| Brian Yandell | Statistics and Horticulture, UW–Madison | |
| Christina Kendziorski Aimee Teo Broman |
Biostatistics & Medical Informatics, UW–Madison | |
| Eric Schadt | Mount Sinai | |
| Danielle Greenawalt Amit Kulkarni |
Merck & Co., Inc. | |
| Śaunak Sen | Epidemiology & Biostatistics, UC-San Francisco | |
| Edgar Spalding Candace Moore Logan Johnson |
Botany, UW-Madison |
31
32