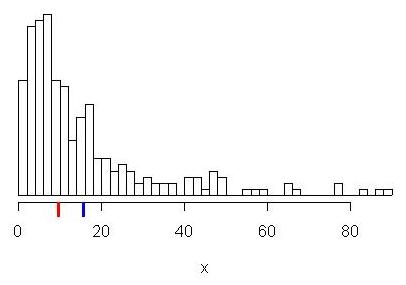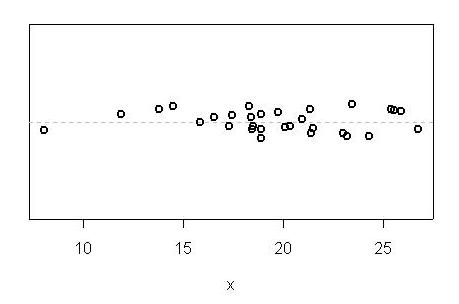


- Name three things wrong with these figures.
- Sketch an improved version of these figures.
    12.5  10.0   9.2  10.0   9.1
    11.0  10.7   9.2  10.1   9.1
- Calculate (using a hand calculator) the arithmetic mean,
median, and SD of the above set of numbers.
- How would the mean, median, and SD change if you added 2 to
each data point?
- How would the mean, median, and SD change if you multiplied each
data point by 10?
- How would the mean, median, and SD change if you multiplied each
data point by -10?
- How would the mean, median, and SD change if you added 2 to
each data point and then multiplied each by 10?
- How would the mean, median, and SD change if you multiplied
each data point by 10 and then added 2 to each?
Also, would you guess the standard deviation (SD) of these data to be 5, 15, or 25?