Clusters
Clear
×
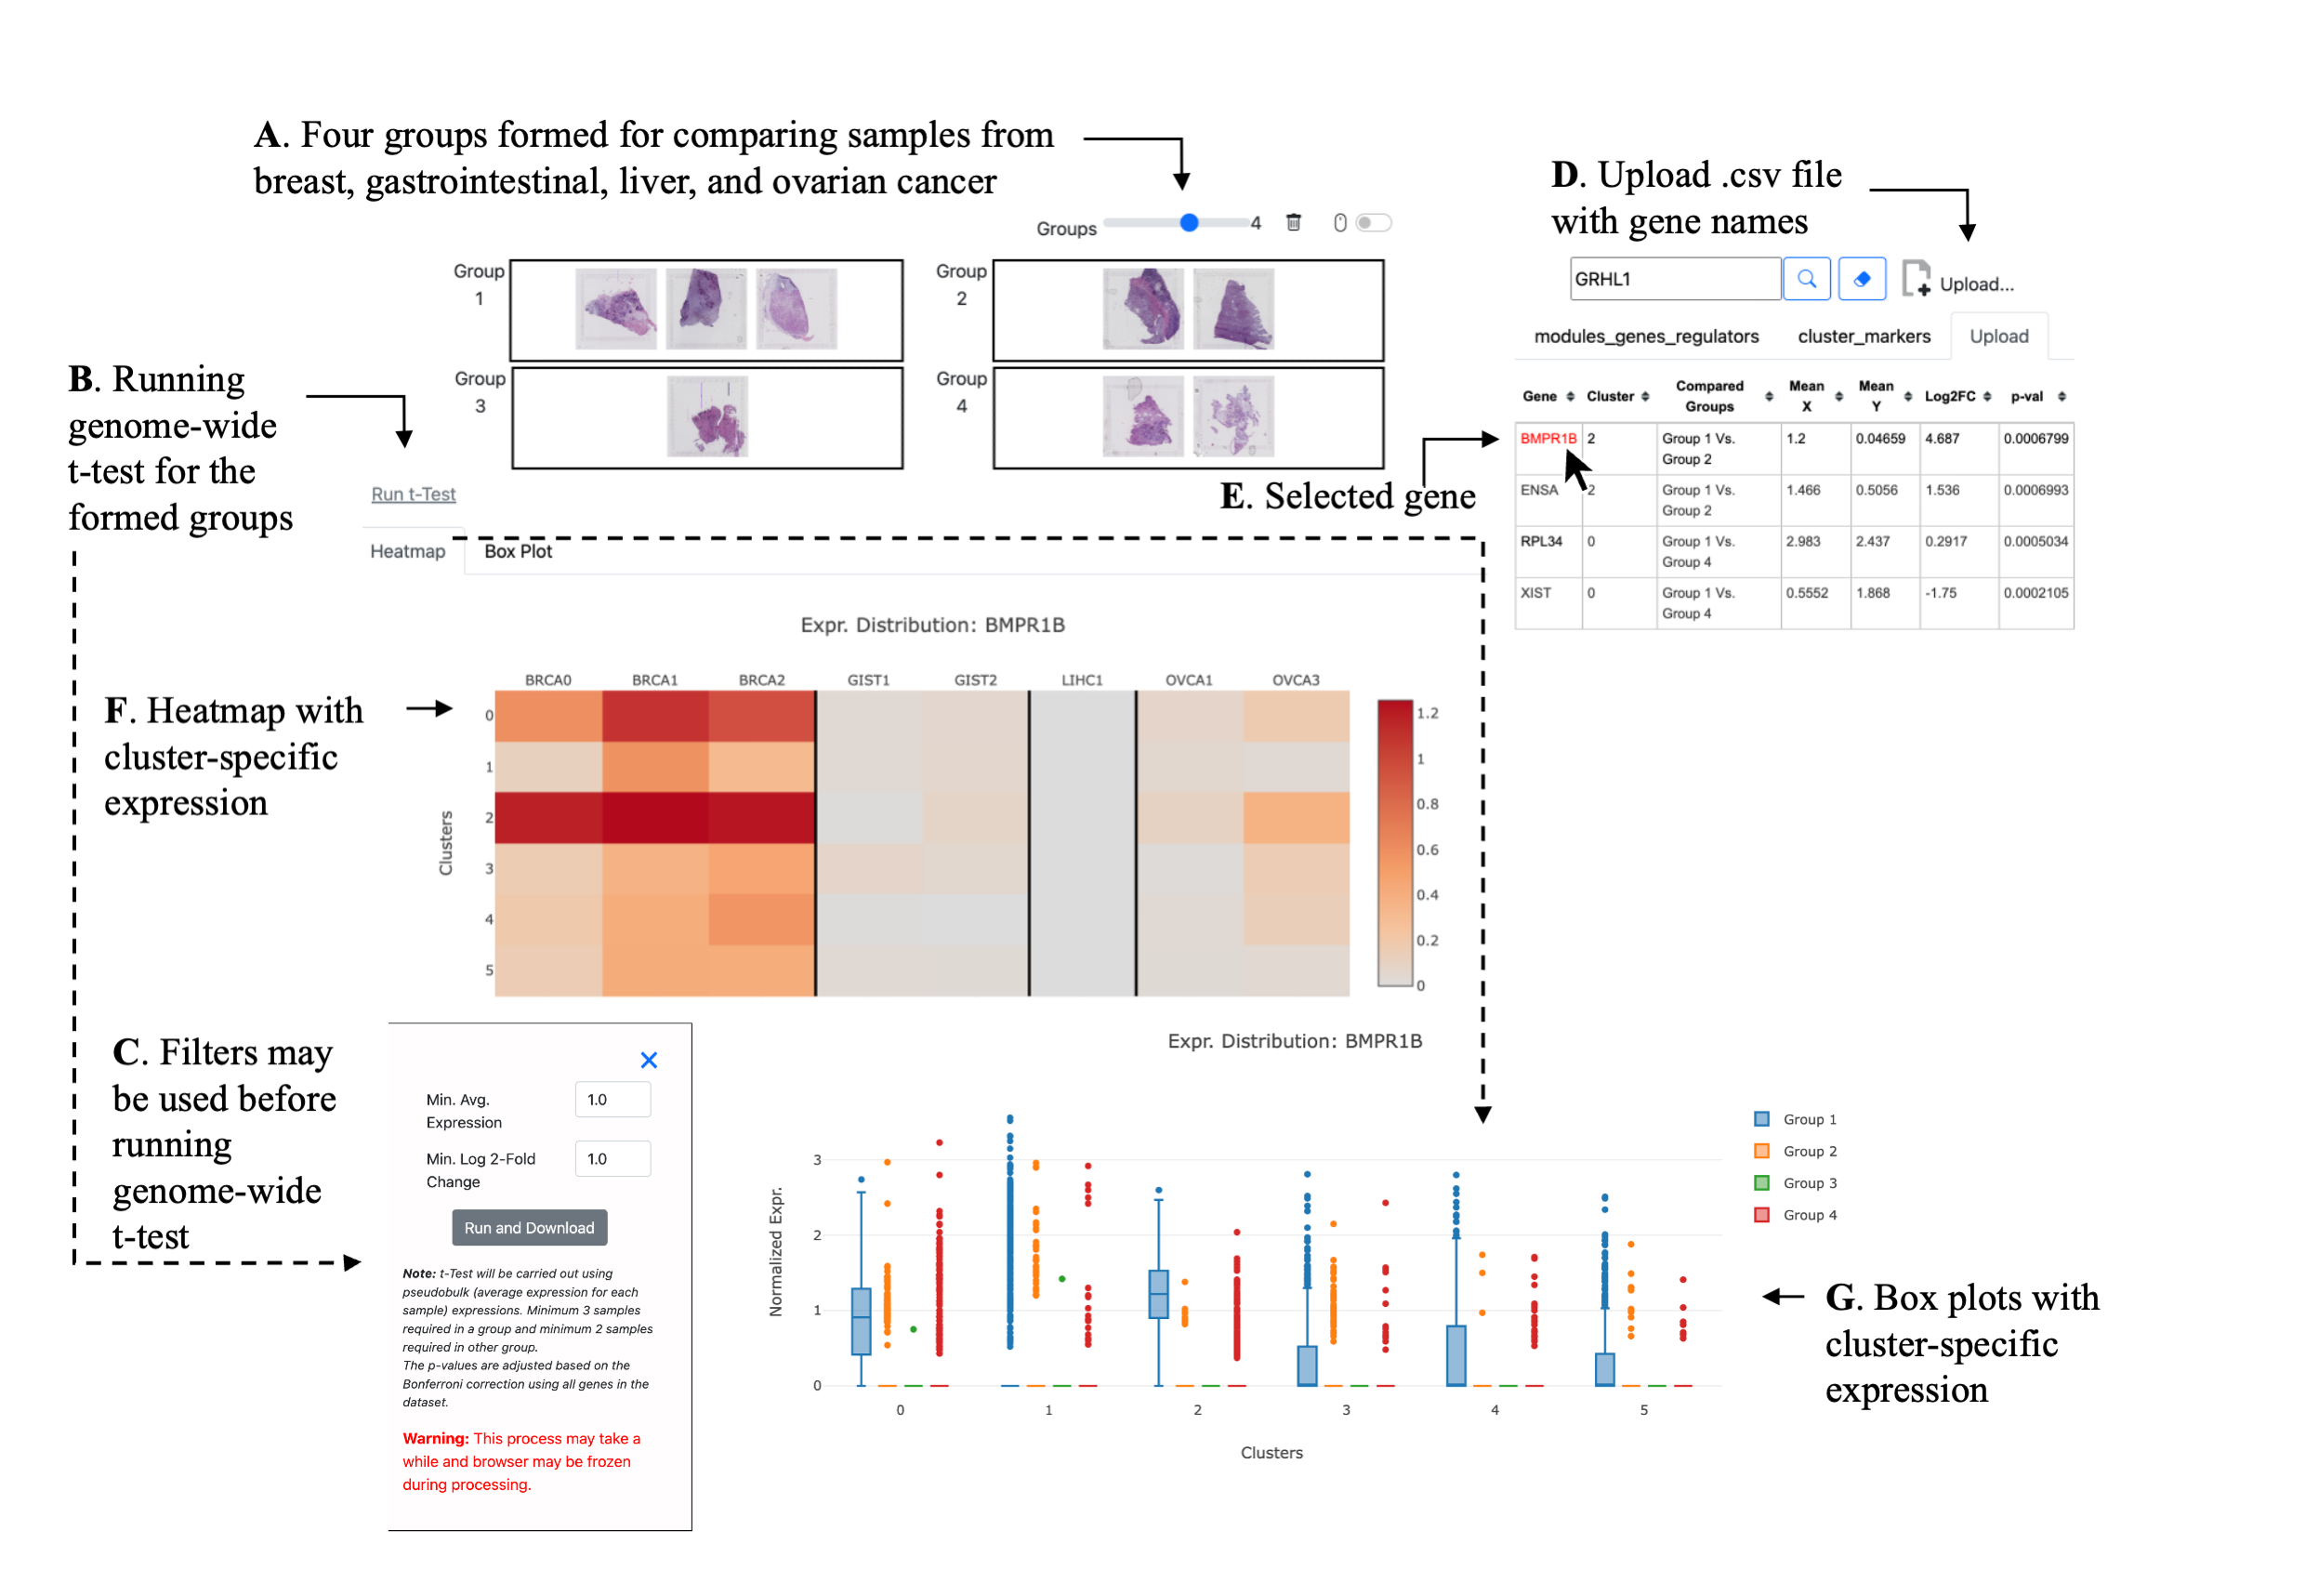
Note: t-Test will be carried out using pseudobulk (average expression for each sample) expressions.
Minimum 3 samples required in a group and minimum 2 samples required in other group.
The p-values are adjusted based on the Bonferroni correction using all genes in the dataset.
Warning: This process may take a while and browser may be frozen during processing.
| Pairwise t-Test | |||
|---|---|---|---|
| Compare | Estimates | Adj. p-Value |
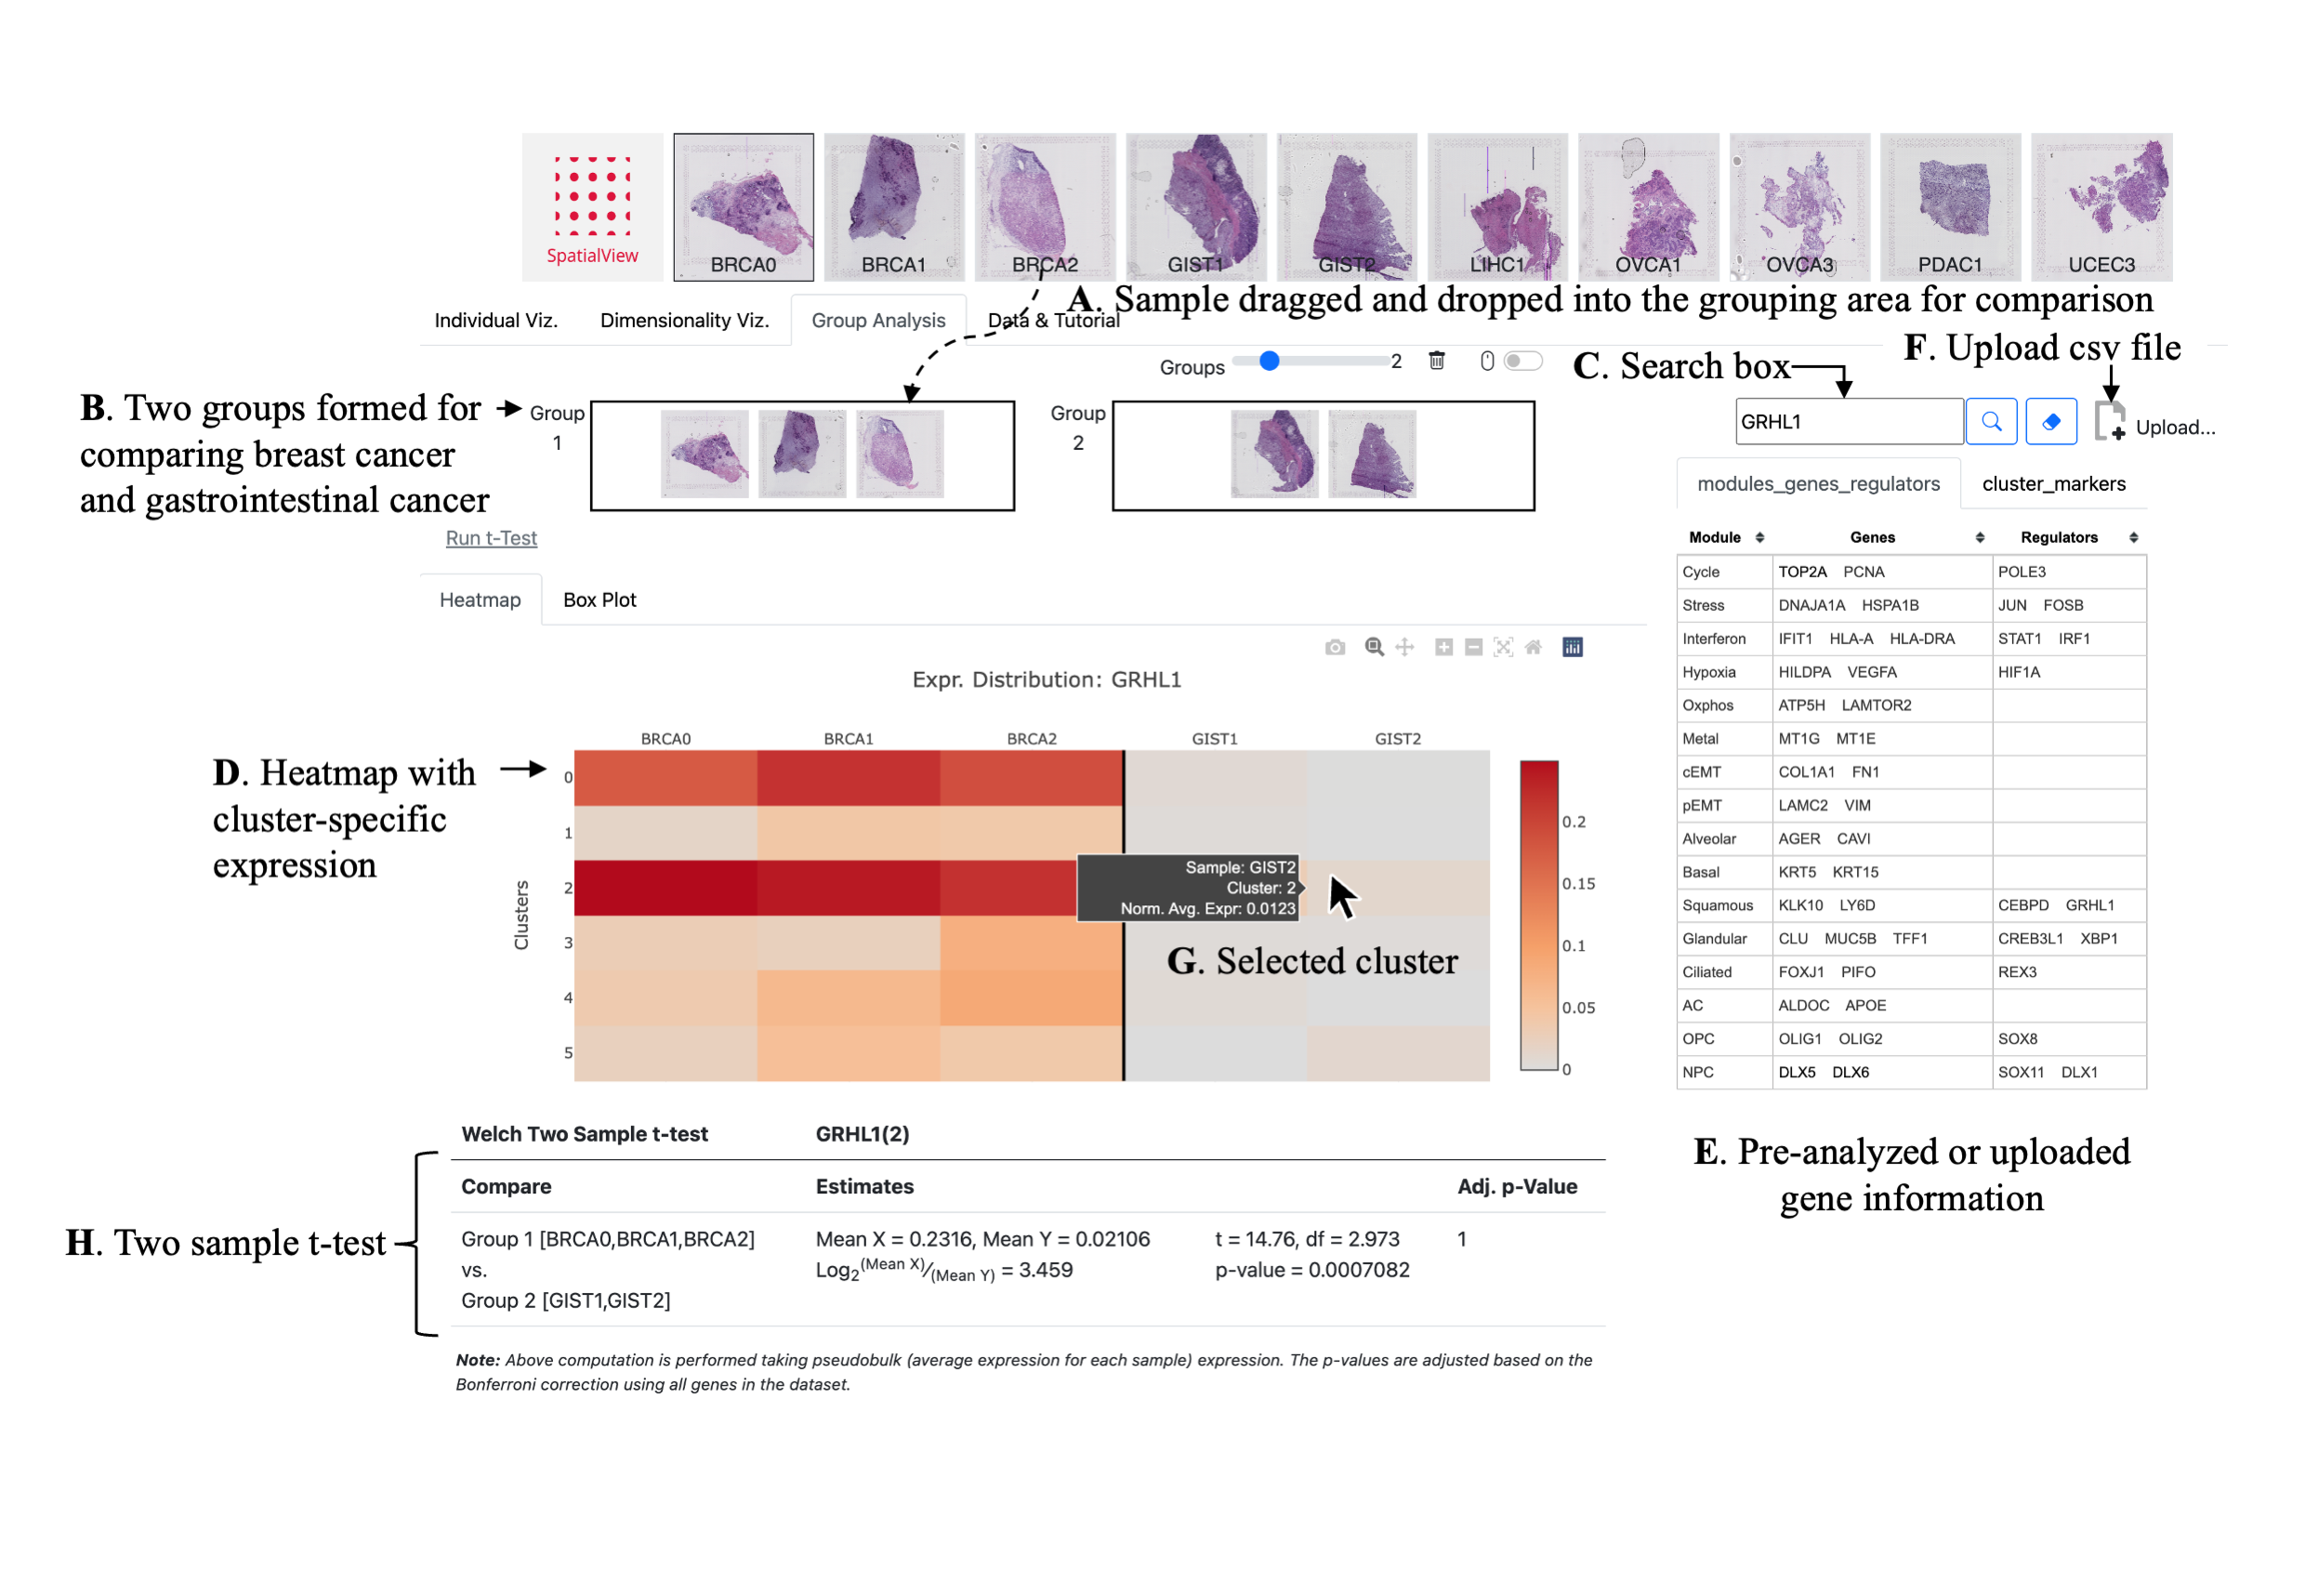
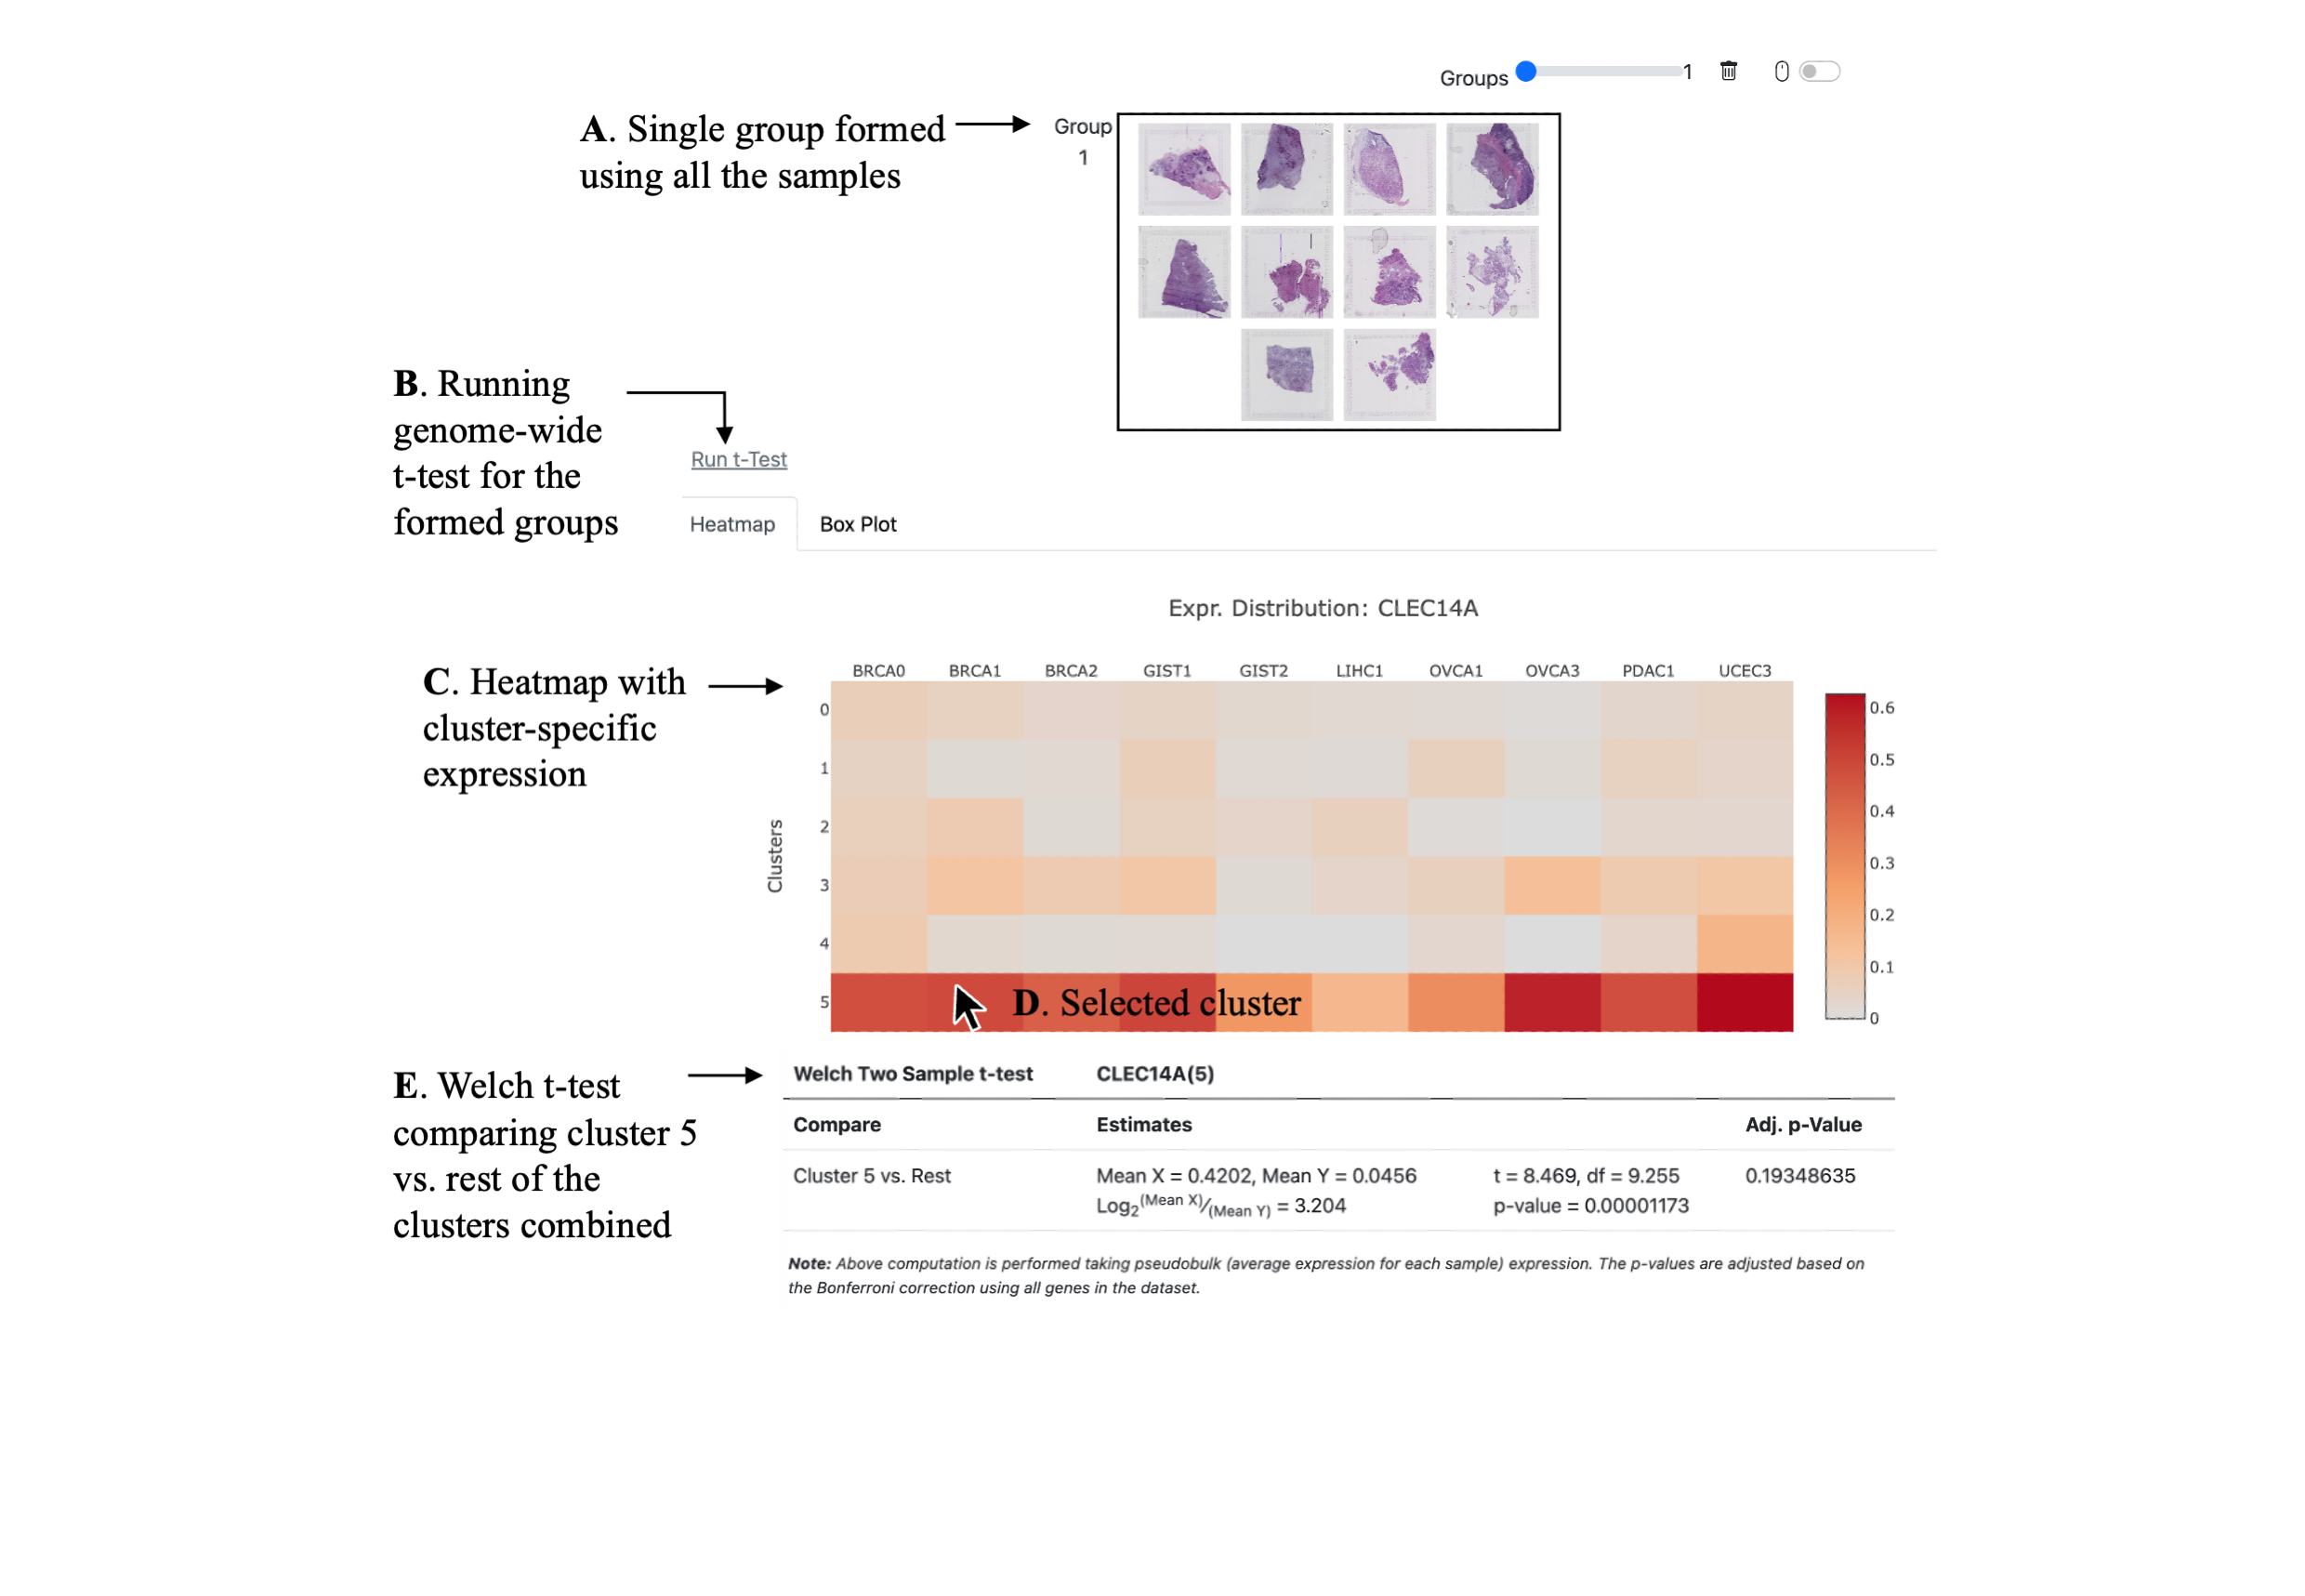
Note: Above computation is performed taking pseudobulk (average expression for each sample) expression. The p-values are adjusted based on the Bonferroni correction using all genes in the dataset.
Spatial Transciptomic (ST) data from 10x experiments can be visualized in SpatialView multiple ways.
Download the file from here to your local
system and Unzip the folder.
Place your processed data in the data folder.
Each sample should have its own directory and may contain following files for a sample:Using the terminal window go to the unzipped folder (use the cd command in the terminal
window to change the folder).
Then run the following command
Then, using your Google Chrome browser, open http://localhost:8000
From R
To run SpatialView from R environment you may use SpatialViewR package. Currently SpatialViewR supports Seurat and SpatialExperiment.- A step by step guide to export data from Seurat object
- A step by step guide to export data from SpatialExperiment object
From Python
To run SpatialView from Python environment you may use SpatialViewPy package. Currently SpatialViewPy supports Scanpy.Code from GitHub
SpatialView application can be downloaded from Github, and can be run in local machine by following steps. Note that, application can run from any http server, however the following steps assume that Python is installed on the local machine and the application runs in Python http.server.Each sample should have its own directory and may contain following files for a sample:
- Expression matrix: Option 1 - Sparse matrix (preferred): compressed sparse column-oriented (CSC) format, barcodes.csv, genes.csv
- cluster_info.csv: columns are "cluster","color","name","genes"
- metadata.csv: A csv file, each row represents a barcodes. A column containing cluster membership is expected
- sample_info.csv: A csv file with sample level metadata information
- scalefactors_json.json: Scale factor file from cellranger output
- tissue_hires_image.png High resolution H&E image from cellranger output
Option 2 - Dense matrix: a csv file with barcodes as columns and genes name in an additional column
python -m http.server 8000
Tutorial: Features of the application and how to use.
Check the details in SpatilView User Guide.
FAQ
Please Visit FAQ sections in Github.If you face any problem or have questions, please raise an issue in GitHub .
Citation
						@Article{author = {Chitrasen Mohanty, Aman Prasad, Lingxin Cheng, Lisa M. Arkin, Bridget E. Shields, Beth Drolet, Christina Kendziorski},
						title = {SpatialView: An interactive web application for visualization of multiple samples in spatial transcriptomics experiments},
						journal = {NA},
						year = {2023},
						doi = {NA},
						url = {NA}
						}
