Attie Lab's Data and Simulation
Attie Lab's Data
We are trying to use Attie Lab's data on inbred mouses(From Jackson's Lab) to have an idea of the heritability range in real data,thus carry out our simulation for latent class regression for finding QTL for complex traits
An introduction to Attie Lab's data and how we calculate the heritability of it is as follows:
519 mice belong to 8 kind of F2 inbred strains
-
2000+ markers on 20 genomes
-
350+ clinical traits, include glucose and insulin levels at 2,4,6,8,10 weeks.
Estimation of heritability in QTL mapping models
We did a literature search and find out that there are generally two estimators of narrow-sense heritability h2 in QTL models,and they are both related to the coefficient of determination R2 of linear regression model.
- Bogdan and Doerge 2005 suggests that given a regression model:
we have an asyntotically unbiased estimator of heritability :
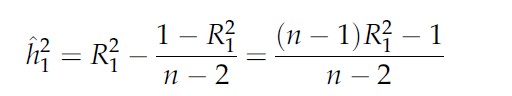
- Kao and Zeng 1999 suggests just using the coefficient of determination R2 as estimation of h2.
Because when sample size is big, these two kind of estimation are very similar, so we just take the R2 as the estimation of h2 when we are analysing the Attie's data
Estimation of heritability in Attie Lab's data
The estimation of narrow sense heritability in Attie lab's data follows these steps:
- Normalization of all the clinical traits: making it range from 0 to 1
- Run scanone on all the 2000+ markers to get LOD scores.
- Select traits that has at least one marker with LOD score larger than 5. (We have 64 such traits out of 350+).
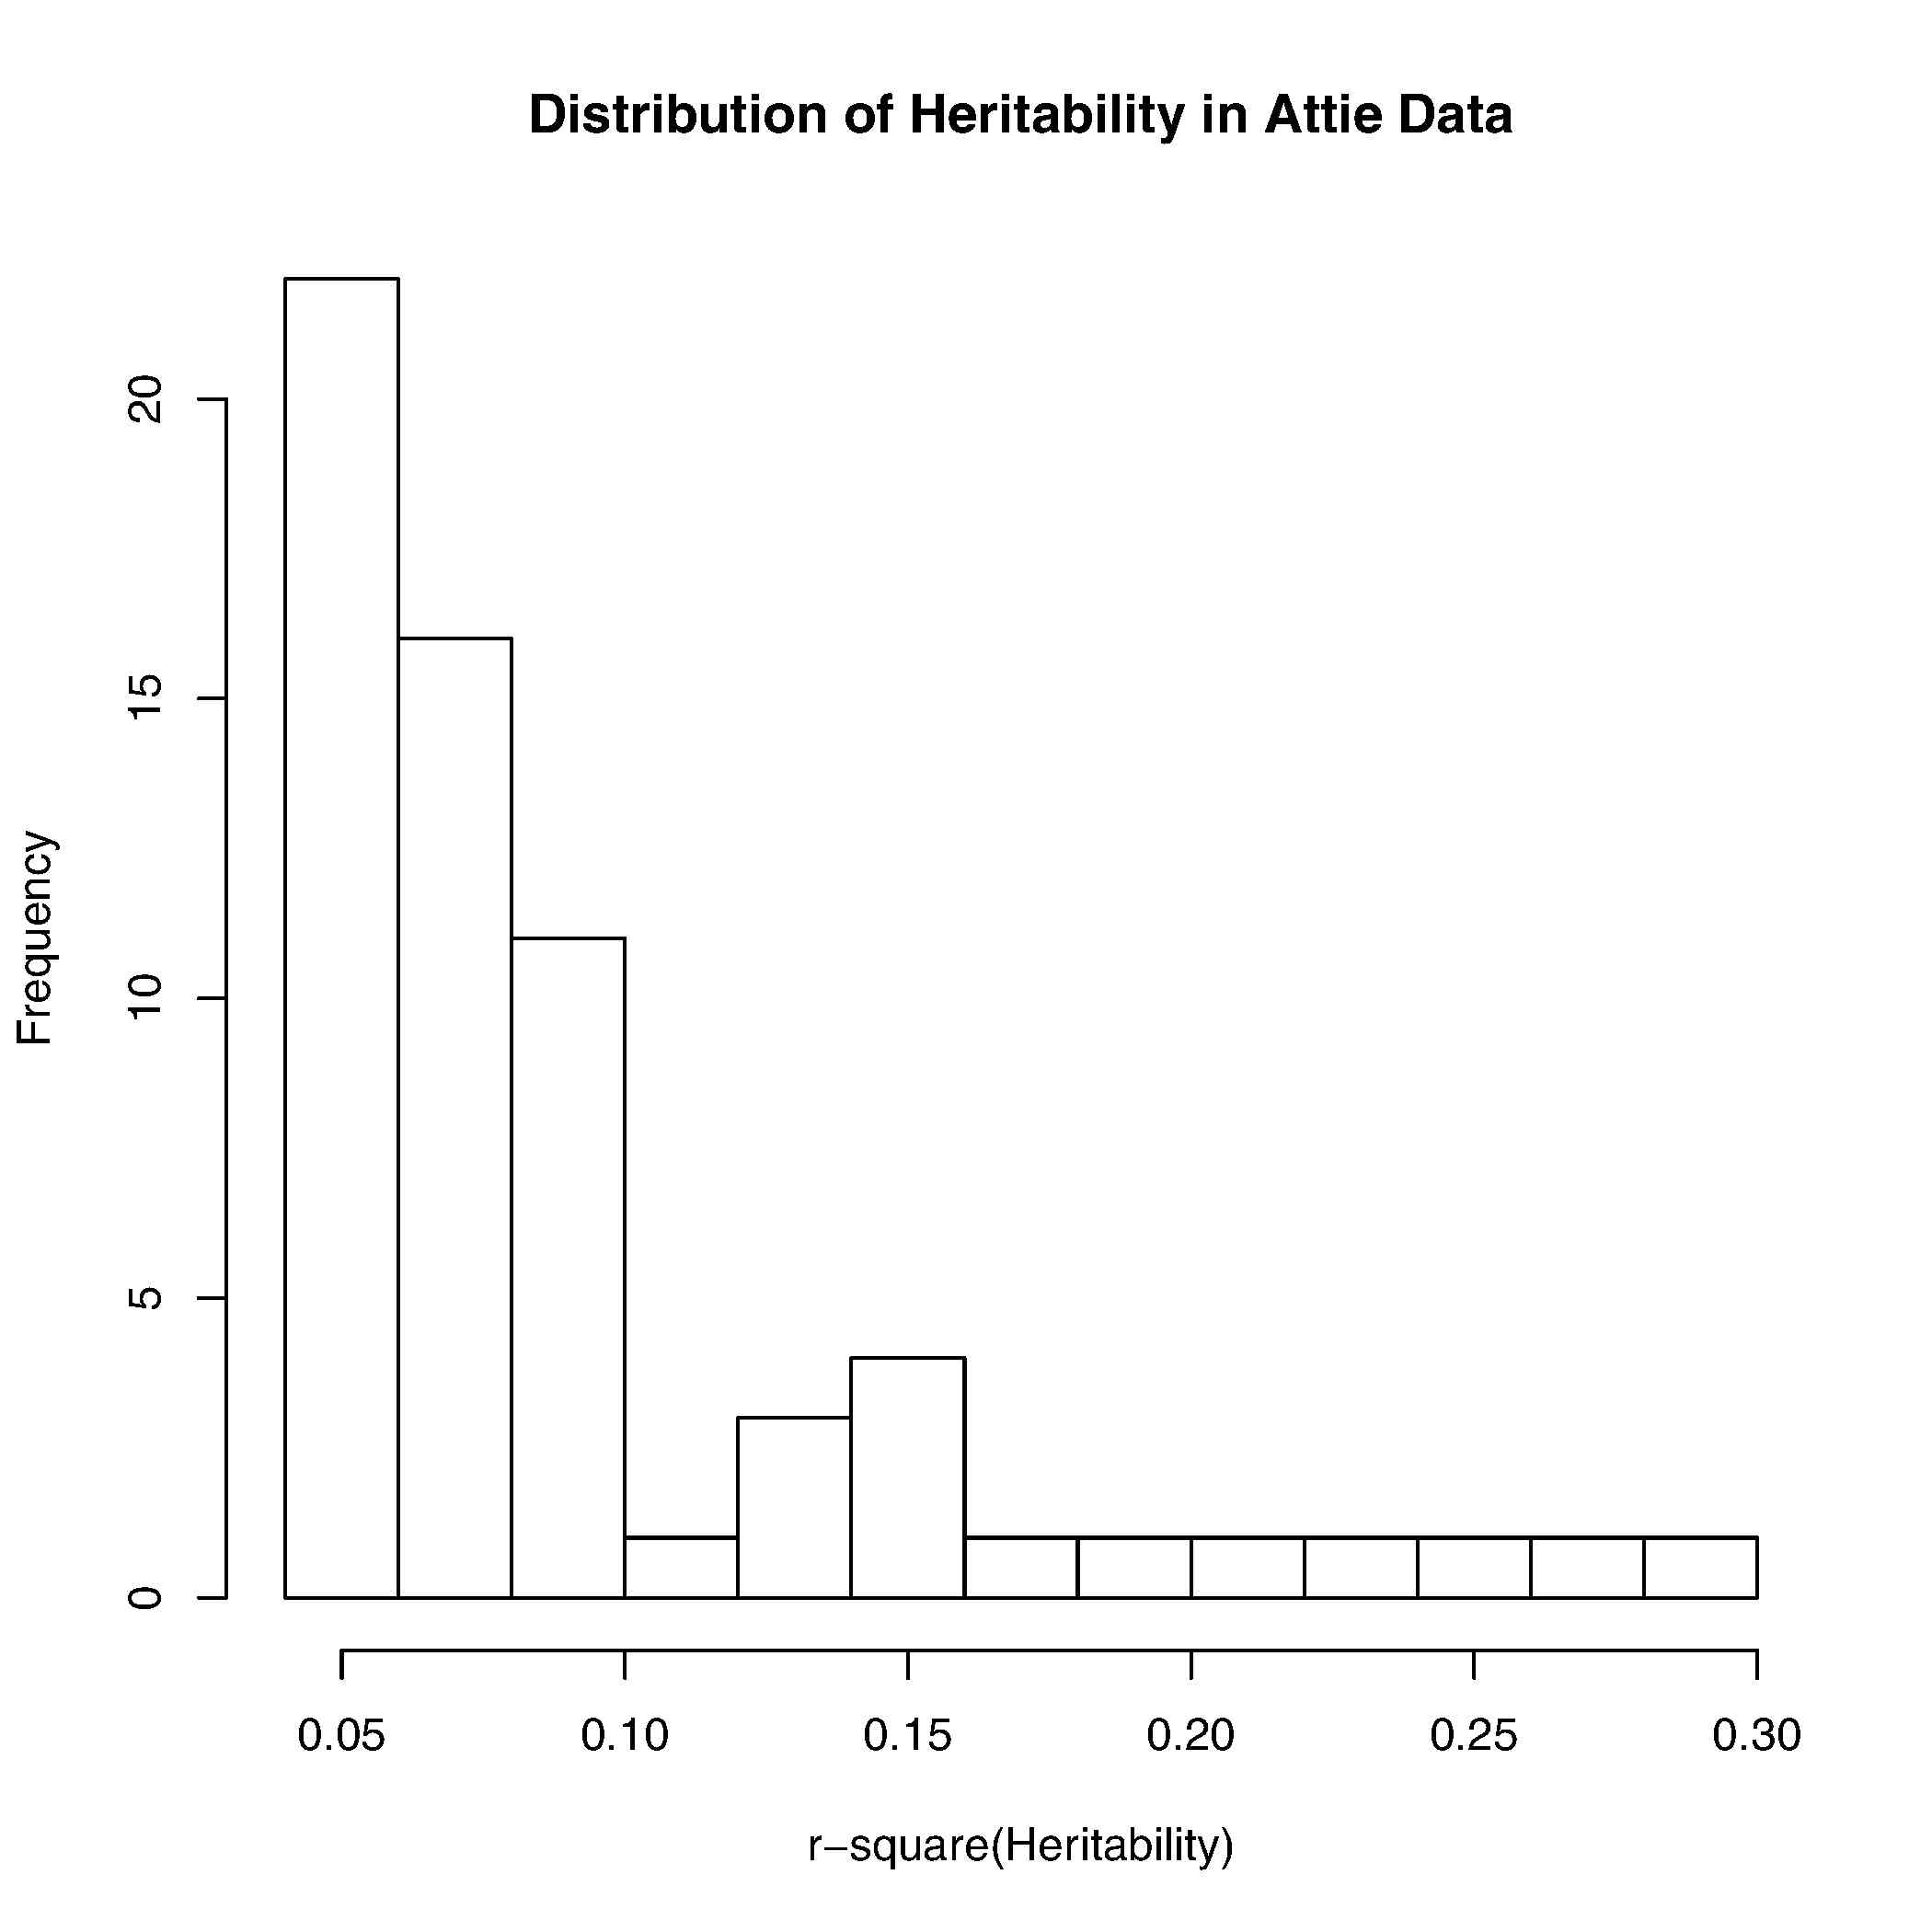
- Do linear regression on trait against the marker with higher lod score, extract R2 from the model.
A distribution of R2 of these 64 traits is in the following histgram:
Bigger Picture
Note that we only include one marker in the model because we will start our simulation with one marker in the model 1st, and gradually move to model with more markers included. We are aware that the R2 can be higher if more markers are included in the model.
The heritability of some of the interesting clinical traits are as follows:
| Clinical Trait | Week 2 | Week 4 | Week 6 | Week 8 | Week 10 |
|---|---|---|---|---|---|
| Glucose | 0.0468 | 0.0595 | |||
| Insulin | 0.0674 | 0.0912 | 0.0664 | ||
| HOMA (insulin*glucose) | 0.0596 | 0.0612 | |||
| Tryglyceride | 0.0438 | 0.0439 | 0.0619 |
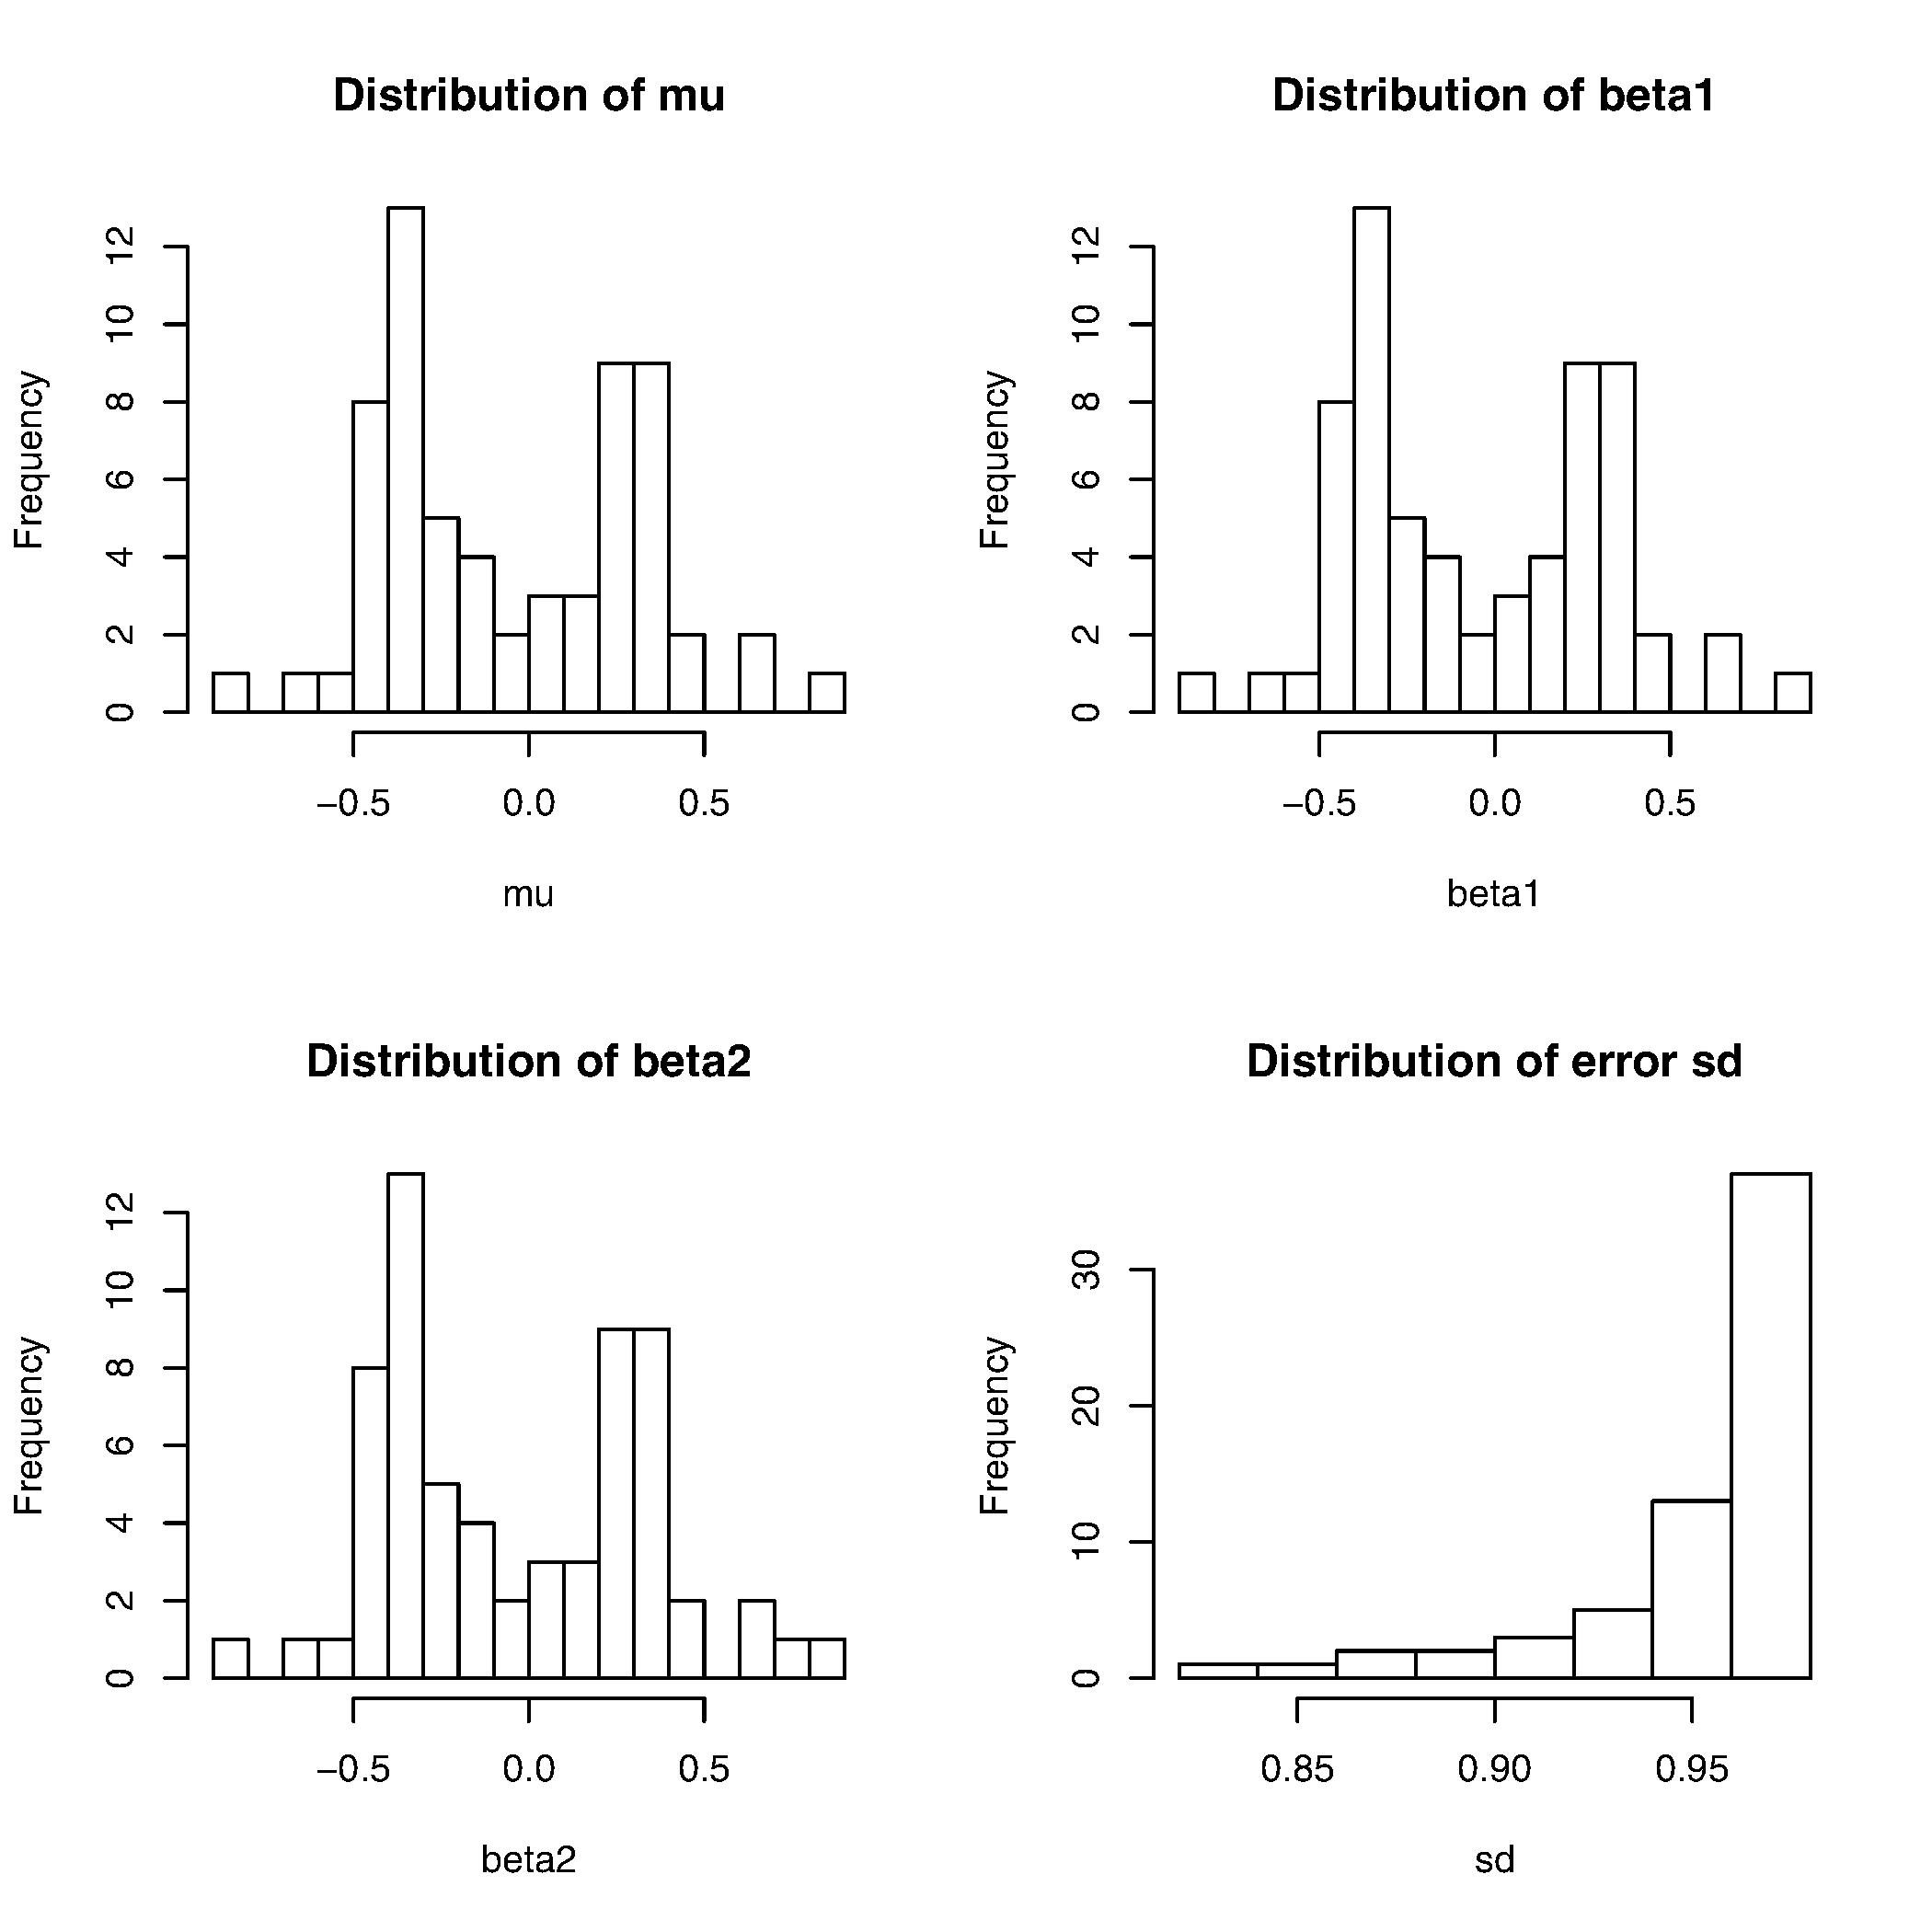
We also have distributions of parameters available here:
Simulation in Other Research Papers Regarding Heritability
We did a literature search and found out the following result on how large the heritability is set to be(and how the data is simulated) in other research papers and found out the following result:
- In Bogdan and Doerge 2005, which they assess the bias of estimator of QTL heritability, they simulate data with h2=0.05. For single locus QTL mapping, they have miu=0, a=0.4588, sigma=1. They figured out that the bias of heritability estimates depends on true heritability, sample size, and the number of chromosomes in interval mapping. See page 479 for graphs.
- In Mogil et al 1999,they studied the heritability of nociception I using 11 inbred mouse strains from Jackson's lab. They stated that Narrow-sense heritability was determined by comparing the between-strain variance to the total variance. This is because animals are isogenic(i.e, genetically identical) within individual inbred strains. Thus between-strain variance provides a measure of addtives genetic(allelic) variance, where within strain variance(error variance) represents environmental variability.There heritability (for 12 different nociception measurements) ranges from 0.30-0.76, please see table 1 on P.71 of the paper.
- In Kao and Zeng et al 1999, they did an analysis on couple traits measured for radiate pine(forestry species), and figured out for one trait called DBH, with one marker in the QTL model, R2=0.0639, and with 2 markers inthe QTL model, R2=0.3202.
- In F2 Chicken population, it is estimated that the highest heritability for hatchability of total eggs(HTE) is 0.28 with sd=0.4.